COVID-19 Data Visualization Dashboard
JavaScriptD3.jsHTML5CSS3REST APIs
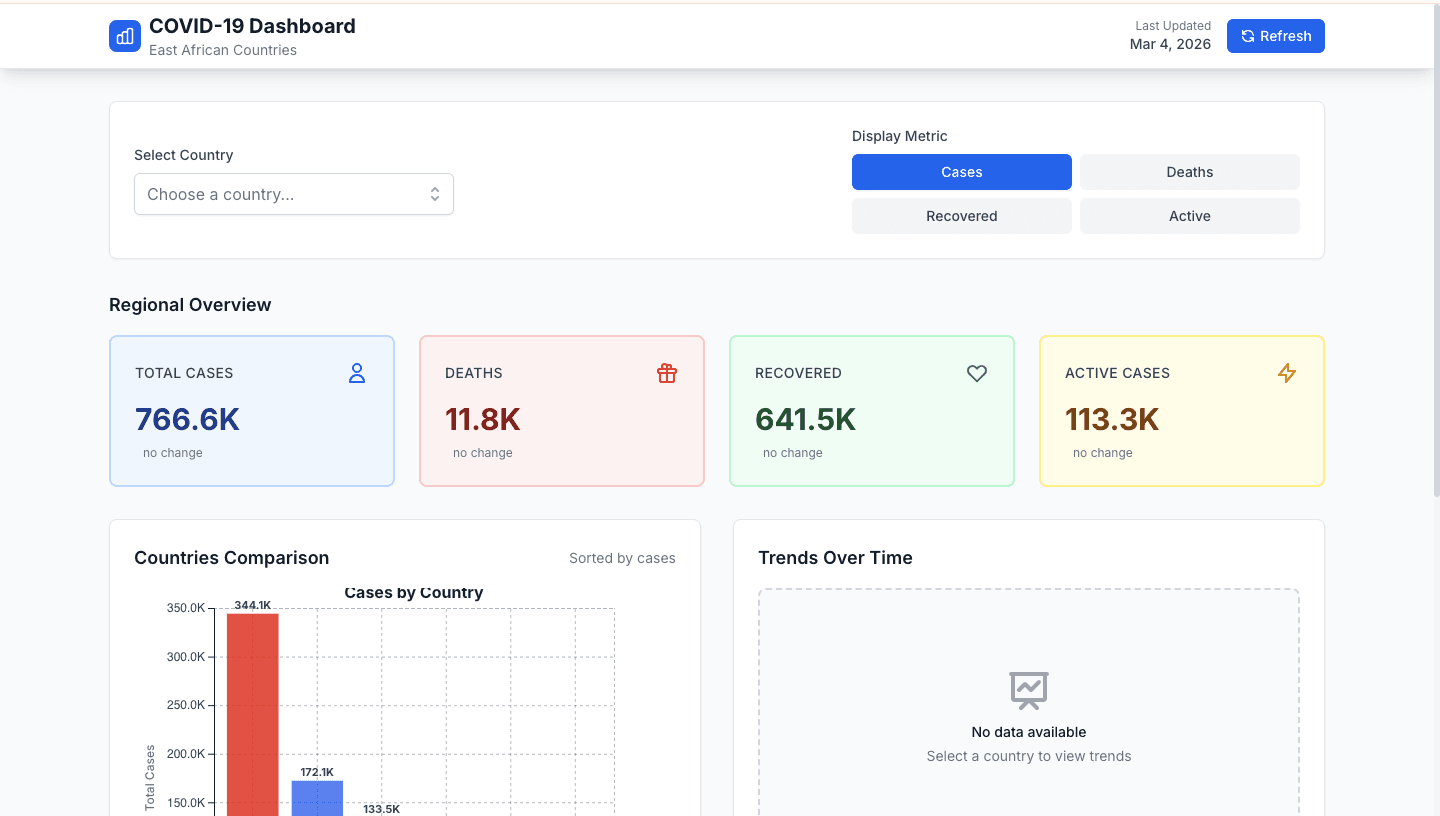
Overview
An interactive D3.js dashboard visualising COVID-19 trends across East Africa. Features real-time data updates, regional breakdowns, and fully responsive design — built to make public health data accessible and readable on any device.
Challenges
- Rendering performant D3.js visualisations with frequently updating datasets
- Presenting regional data meaningfully without overcrowding the visualisation
- Ensuring the dashboard was fully usable on low-end mobile devices
Solutions
- Debounced data refresh cycles and used D3 transitions to update charts in place rather than re-rendering from scratch
- Designed a drill-down interaction model: national overview → country → region, reducing visual complexity at each level
- Used a mobile-first CSS approach and lazy-loaded chart components to keep initial load fast on slower connections
Languages & Tools
JavaScript
D3.js
HTML5
CSS3
REST APIs